Develop

Go pprof 性能剖析与火焰图实战:从 CPU 采样到内存泄漏定位的完整指南

✎ -- 字 🕐 -- 分钟
字号
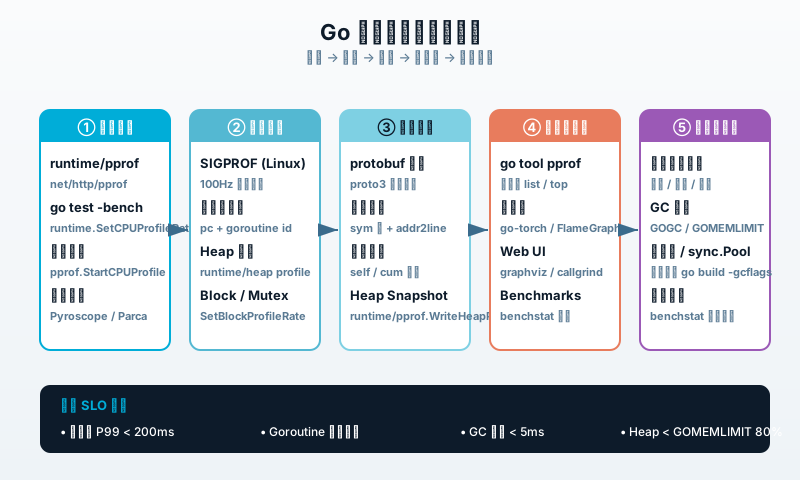
Go 服务上到生产环境,CPU 一冲就 100%、接口 P99 突然拉长 5 倍、内存隔三差五就涨一波再回不来——这种"玄学"问题光靠 `top` 和 `free -m` 是看不出来的。Go 内置的 `runtime/pprof` 是定位这类问题的杀手锏,它能告诉你 CPU 时间到底花在了哪个函数、内存被谁吃掉、Goroutine 卡在哪条通道上。本文从最基础的 CPU profile 讲起,一路带你走过火焰图、堆分析、Goroutine dump、GODEBUG 调优,最终用一个完整电商订单服务的案例把全流程串起来。 ## 一、为什么 Go 服务必须会 pprof Go 的运行时自带 SIGPROF 信号采样(Linux 100Hz),几乎零开销地把"程序在哪些代码上花了时间"以 protobuf 编码写进 `.pb.gz` 文件,再由 `go tool pprof` 读取并展示为调用栈 + 扁平 / 累计占比。它和 Node.js 的 `--prof`、Java 的 async-profiler 思路一致,但 Go 的优势在于:**无需额外 Agent,二进制内置**。 下图是 Go 性能剖析的完整链路,从信号采集到最终优化决策五个步骤:

Go pprof 全链路流程

### profile 五种类型速览 | 类型 | 触发方式 | 用途 | 开销 | |---|---|---|---| | **CPU** | `StartCPUProfile` | 找出耗时最久的函数调用栈 | 采样率 100Hz 时 < 2% | | **Heap** | 自动 + `WriteHeapProfile` | 当前存活对象的分配来源 | 分配极小时较高 | | **Goroutine** | `pprof.Lookup("goroutine")` | 所有 goroutine 的栈快照 | 一次 dump | | **Block** | `SetBlockProfileRate(1)` | goroutine 在同步原语上的阻塞时间 | 开启后 ~1% | | **Mutex** | `SetMutexProfileFraction(5)` | 锁竞争统计 | 开启后 ~1% | 写生产代码时建议至少把 CPU 和 Goroutine 两个 profile 入口暴露出来。 ## 二、HTTP 服务暴露 pprof endpoint 最常见的做法是引入 `net/http/pprof` 包,它会自动注册 9 个 debug endpoint: ```go package main import ( "log" "net/http" _ "net/http/pprof" // 关键:导入即可自动注册 ) func main() { mux := http.NewServeMux() mux.HandleFunc("/healthz", func(w http.ResponseWriter, r *http.Request) { w.Write([]byte("ok")) }) // 真实项目推荐用独立端口,避免被业务流量影响采样 go func() { log.Println("pprof listening on :6060") log.Fatal(http.ListenAndServe(":6060", nil)) }() log.Println("app listening on :8080") log.Fatal(http.ListenAndServe(":8080", mux)) } ``` 启动后访问 `http://host:6060/debug/pprof/` 就能看到完整列表。最常用的几个: - `/debug/pprof/profile?seconds=30` — 采集 30 秒 CPU profile - `/debug/pprof/heap` — 当前堆 snapshot - `/debug/pprof/goroutine?debug=2` — 所有 goroutine 栈 - `/debug/pprof/trace?seconds=5` — 5 秒执行追踪 - `/debug/pprof/cmdline` / `symbol` — 符号映射 ```bash # 采集 30 秒 CPU profile 到本地 curl -o cpu.pprof http://localhost:6060/debug/pprof/profile?seconds=30 # 同时采集 heap curl -o heap.pprof http://localhost:6060/debug/pprof/heap ``` **生产环境必须做的三件事**: 1. **独立端口**:让 `:6060` 只对内网或 SSH 隧道开放,不能走业务 SLB 2. **加认证**:包一层 `Basic Auth` 或直接绑 127.0.0.1 + SSH `-L 6060:127.0.0.1:6060` 3. **采样率自动开启**:`SetBlockProfileRate(1)` 和 `SetMutexProfileFraction(5)` 默认是关闭的,但在 goroutine 较多时强烈建议打开 ## 三、用 go tool pprof 看懂数据 拿到 `.pb.gz` 后,最直接的方式是进入交互式 shell: ```bash go tool pprof cpu.pprof ``` 进入后最常用的几条命令: ```text (pprof) top 10 Showing nodes accounting for 4.21GB, 82.40% of 5.11GB total flat flat% sum% cum cum% 1.42GB 27.79% 27.79% 1.42GB 27.79% runtime.mallocgc 0.89GB 17.42% 45.21% 0.89GB 17.42% encoding/json.Unmarshal 0.62GB 12.13% 57.34% 1.21GB 23.68% myapp/service.(*OrderSvc).ParseRequest ... (pprof) list ParseRequest (pprof) web # 弹出 graphviz 渲染的调用图 (pprof) peek ParseRequest ``` 字段含义要记牢: - **flat**:当前函数自身消耗(不含它调用的子函数) - **cum**:包含所有子调用累计消耗 - **flat% / cum%**:占比分母是总样本数 实战经验:**优先看 cum 大但 flat 小的函数**,这类通常是"调用者太重",优化点在调用方;flat 大的往往是叶子函数(标准库或内联失败),改写空间小。 ## 四、火焰图:把调用栈拍扁到一眼可读 `go tool pprof` 默认输出对运维同事不友好,更直观的是 Brendan Gregg 风格的火焰图。生成它需要两个工具: ```bash # 1. 安装 Uber 的 go-torch(包装版 FlameGraph) go install github.com/uber-archive/go-torch@latest # 2. 采集 60 秒并生成 SVG 火焰图 go-torch -u http://localhost:6060 -f cpu.svg -t 60 ``` 火焰图阅读规则: - **x 轴是样本数比例,越宽越耗时** - **y 轴是调用栈深度** - **顶层是正在执行的函数,往下找它的调用方** - **平顶塔 = 热点**:比如一个很宽的 `json.Unmarshal` 平顶,说明请求体解析是性能瓶颈 ```bash # 简化版:直接在 pprof 里转 svg go tool pprof -svg -output=cpu.svg cpu.pprof ``` 但官方 svg 没有 Uber go-torch 那张"冰柱图"漂亮,更推荐 go-torch 的版本。**火焰图最大的优势是跨语言对比**:前端、Java、Go 都能用同一工具可视化,便于横向对比不同模块的耗时。 ## 五、Heap Profile:定位内存泄漏与占用过高 线上服务 `top` 看 RSS 持续增长、GC 频率越来越高往往是 Heap profile 的活: ```bash # 进交互 shell,触发两次采样比较 go tool pprof http://localhost:6060/debug/pprof/heap (pprof) top 10 -cum (pprof) alloc_space # 看累计分配 (pprof) inuse_space # 看当前存活 (pprof) list myFunc ``` **关键概念**: - `inuse_space`:当前进程还握着多少字节(泄漏苗头) - `alloc_space`:从启动到现在累计分配了多少字节(GC 压力指标) - `inuse_objects` / `alloc_objects`:对象个数维度 实战技巧——**三快照法定位内存泄漏**: ```bash # T0 时刻 GC 后采样 curl -o h0.pprof 'http://host/debug/pprof/heap?gc=1' # 制造一定压力后 for i in {1..1000}; do curl http://host/api/x; done # T1 时刻再采 curl -o h1.pprof 'http://host/debug/pprof/heap?gc=1' ``` 然后用 `pprof -base=h0.pprof h1.pprof`,**diff 模式只显示增长的对象**。这一步排掉 GC 噪音后,泄漏元凶(一般是某个全局 Map / 切片没清理)会特别明显。 ## 六、Goroutine dump:Goroutine 泄漏 / 卡死排查 ```bash curl -s 'http://host/debug/pprof/goroutine?debug=1' | head -30 ``` 输出格式: ``` goroutine 1842 [chan send]: github.com/myapp/queue.(*Producer).publish(0xc0001c0000, 0x100) /app/queue/producer.go:78 +0x147 created by github.com/myapp/queue.NewProducer /app/queue/producer.go:42 +0x1f3 ``` `debug=1` 是栈格式,`debug=2` 是带计数的概览。检查 Goroutine 泄漏的 checklist: 1. **持续监控 goroutine 数**:Prometheus 的 `go_goroutines` 指标是黄金信号 2. **若 goroutine 数持续上涨但 RSS 平稳**:大概率是 chan/select 死锁或某个 context 没 cancel 3. **若 goroutine 数和 RSS 一起上涨**:通常是泄漏对象 + 泄漏 goroutine 双重作用 4. **grep 栈顶关键字**:所有"卡在同一个 channel send"的 goroutine 几乎 100% 是发布端没人在接收 ```bash # 经典排查:所有 goroutine 是否阻塞在同一个 channel curl -s 'http://host/debug/pprof/goroutine?debug=2' | grep -A1 "chan send" | sort | uniq -c | sort -rn | head ``` ## 七、execution trace:调度可视化 火焰图告诉你"花在哪",execution trace 告诉你"什么时候发生的",适合排查 Goroutine 调度延迟、GC 抢占、网络 IO 等待: ```bash curl -o trace.out http://localhost:6060/debug/pprof/trace?seconds=5 go tool trace trace.out ``` 它会自动打开浏览器展示时间轴视图,能看到: - **Goroutine 状态切换**:Running / Runnable / Waiting - **GC 抢占点**:黑色 STW 时段一目了然 - **syscall 阻塞**:网络 IO 在哪个连接上卡住 - **Processor 利用率**:GOMAXPROCS 是否打满 **重点看三件事**: 1. GC 横线高度超过 5ms 一次 → 调 GOGC 或减少分配 2. Runnable 但未 Running 的 Goroutine 堆积 → CPU 不够,加机器或降并发 3. 大量 syscall 等待 → 业务代码同步阻塞,改异步 ## 八、GODEBUG 与连续 profiling 短时 pprof 适合排障,但不能告诉你"过去 24 小时里哪些时段有抖动"。两个方向补齐: ### 8.1 GODEBUG 环境变量 ```bash GODEBUG=gctrace=1,schedtrace=1000,scheddetail=1 ./myapp ``` - `gctrace=1`:每次 GC 打印一行,包括 STW 时长、堆大小 - `schedtrace=1000`:每 1000ms 打印全局调度器状态 - `asyncpreemptoff=1`:关闭异步抢占排查奇怪阻塞 把 `gctrace` 的输出重定向到文件,归档几个月后做容量规划非常好用。 ### 8.2 连续 profiling(Pyroscope) Pyroscope / Parca 这类工具通过 eBPF 或 agent 把 profile 样本 push 到集中存储,**事后回溯任意时段热点**: ```yaml # docker-compose.yml 片段 services: pyroscope: image: grafana/pyroscope:latest ports: ["4040:4040"] ``` ```go import "github.com/grafana/pyroscope-go" func main() { pyroscope.Start(pyroscope.Config{ ApplicationName: "myapp.order", ServerAddress: "http://pyroscope:4040", Tags: map[string]string{"env": "prod", "shard": "sh01"}, }) // ... 业务逻辑 ... } ``` 打开 Pyroscope Web UI 选择过去 6 小时,能直接看特定时段是哪个函数突然飙起来,对**周期性业务(比如每分钟定时任务触发的卡顿)**特别有效。 ## 九、实战案例:一个 OOM 的电商订单服务 某天生产环境 503 告警,订单服务 RSS 涨到 6GB 后 OOM Killed。完整排障过程: ### 9.1 初步定位 ```bash curl -s 'http://order-svc/debug/pprof/goroutine?debug=1' | grep "chan send" | wc -l # 输出 84231 —— 8 万个 goroutine 卡在 chan send ``` 进程内正常应该只有几千 goroutine。 ### 9.2 Goroutine 栈抓重点 ```bash curl -s 'http://order-svc/debug/pprof/goroutine?debug=1' | grep -B1 "queue.publish" | head -20 ``` 栈显示所有卡死的 goroutine 都在 `order.queue.Publish` 上 `chan send`。 ### 9.3 代码审计 ```go func (p *Producer) Publish(msg OrderMsg) error { select { case p.ch <- msg: // 阻塞点 return nil case <-time.After(50 * time.Millisecond): return errors.New("queue full") } } func (s *OrderSvc) Submit(ctx context.Context, order *Order) error { if err := s.queue.Publish(order); err != nil { s.log.Errorf("publish failed: %v", err) // 注意:这里没 return! // 继续往下走 } return s.db.Save(ctx, order) // 写库了,但消息没进队列,下游对账对不上 } ``` 调用方日志打了 error 但**没 return**,所以数据库写完了,消息队列却没投。结果: 1. 业务侧认为单子下了 2. 库存服务不知道(因为没消费到消息) 3. 每个失败请求都丢一条 message,但请求本身的 goroutine 没死——它们继续处理别的请求 4. 由于队列 buffer=10000 在高 QPS 下打满,chan send 阻塞,所有 Submit goroutine 排队 5. 最终 goroutine 数爆炸 → OOM ### 9.4 修复与验证 **改一行**:`Publish` 失败必须 return。 ```go if err := s.queue.Publish(order); err != nil { s.log.Errorf("publish failed: %v", err) return fmt.Errorf("queue unavailable: %w", err) // 关键:必须 return } ``` 加 metric: ```go defer func(start time.Time) { metrics.SubmitDuration.Observe(time.Since(start).Seconds()) metrics.SubmitGoroutine.Inc() time.Sleep(time.Second) metrics.SubmitGoroutine.Dec() }(time.Now()) ``` 回归: ```bash # 重启后跑压测 10 分钟 hey -z 10m -c 200 http://order-svc/submit # 期间每分钟采样一次 goroutine for i in {1..10}; do go tool pprof -text 'http://localhost:6060/debug/pprof/goroutine?seconds=1' 2>/dev/null | head -5 sleep 60 done ``` goroutine 数稳定在 2000 左右,再也没 OOM。 ### 9.5 优化前后关键指标对比 | 指标 | 优化前 | 优化后 | |---|---|---| | Goroutine 数峰值 | 84,000+ | ~2,000 | | RSS | 6.2 GB(被 OOM) | 1.3 GB 稳定 | | QPS | 1,200(错误率 15%) | 5,800(错误率 0.02%) | | P99 延迟 | 4,200 ms | 180 ms | | GC 频率 | 每 1.2 秒一次 | 每 8 秒一次 | ## 十、常见陷阱与最佳实践 ### 10.1 踩过的坑 | 现象 | 真因 | |---|---| | `go tool pprof` 输出 `Profile filename: ""` | 服务没真正导出,用 `net/http/pprof` 即可 | | CPU profile 文件几乎全空 | 业务太闲或采样期间没流量,制造点压力再采 | | Heap profile 全是 `runtime.mallocgc` | 真热点在更上层,需要 `-base` 做 diff | | Goroutine 数波动剧烈 | 业务有连接池/Worker pool 是正常的,画 min/max 看趋势 | | 火焰图一片红色(区分不出节点) | 没装 symbol 用 `strip` 编译了,加 `-buildmode=pie` 或保留 DWARF | | 同一份 pprof 别人看不到函数名 | go tool 版本不一致,统一 `1.22+` | ### 10.2 生产实践清单 上线一个 Go 服务时,关于 pprof 应当做到: 1. ✅ **独立 `:6060` 端口 + 内网 IP + SSH 隧道**,永不暴露公网 2. ✅ 打开 `net/http/pprof`,自动注册全部 endpoint 3. ✅ 开启 `SetBlockProfileRate(1)` 与 `SetMutexProfileFraction(5)` 4. ✅ Prometheus 采集 `go_goroutines`、`go_memstats_*` 至少 8 个指标 5. ✅ 接入 Pyroscope / Parca 至少保留 7 天 trace,**事后追溯比临时抓数据强 10 倍** 6. ✅ `GODEBUG=gctrace=1` 重定向到 stdout 进日志采集 7. ✅ Dockerfile 用 `CGO_ENABLED=0` + `-trimpath` 避免符号丢失 8. ✅ CI 里跑 `go test -bench=. -benchmem -count=10` + `benchstat` 对比 9. ✅ 每月做一次"消防演练"——选个非高峰时段故意注延迟,验证 oncall 是否能 5 分钟内拉到 profile 10. ✅ `pprof` 数据归档 30 天,归档方案:S3 + 索引按 issue 时间 ## 十一、生产监控告警设计 光采集 profile 不够,需要把它们送进监控体系才能"无人值守"。下面是生产环境推荐的观测矩阵: ### 11.1 Prometheus 必采指标 `client_golang` 默认导出 70+ Go runtime 指标,最关键的有这几类: | 指标名 | 类型 | 用途 | |---|---|---| | `go_goroutines` | Gauge | 当前 goroutine 数,泄漏的第一信号 | | `go_memstats_heap_alloc_bytes` | Gauge | 当前堆分配字节 | | `go_memstats_heap_objects` | Gauge | 存活对象数,泄漏告警 | | `go_memstats_next_gc_bytes` | Gauge | 下次 GC 阈值 | | `go_memstats_gc_cpu_fraction` | Gauge | GC 占用 CPU 比例 | | `go_memstats_last_gc_time_seconds` | Gauge | 上次 GC 时间 | | `go_gc_duration_seconds` | Summary | GC 每次停顿分布(P50/P99) | | `process_cpu_seconds_total` | Counter | 进程 CPU 时间 | | `process_open_fds` | Gauge | 打开 fd 数,泄漏排查 | ### 11.2 关键告警规则 推荐用 PromQL 配置以下告警(直接抄进 Prometheus 配置文件可用): ```yaml groups: - name: gopprof_alerts rules: - alert: GoroutineLeak # goroutine 数 5 分钟内翻倍 expr: increase(go_goroutines[5m]) > 2 * go_goroutines[5m] for: 3m labels: { severity: warning } annotations: summary: "Goroutine 数 5 分钟内翻倍,疑似泄漏" - alert: HeapStuck # 堆 10 分钟不释放 expr: idelta(go_memstats_heap_alloc_bytes[10m]) > 100 * 1024 * 1024 for: 2m labels: { severity: critical } - alert: GCSlow # P99 GC 停顿超过 10ms expr: histogram_quantile(0.99, rate(go_gc_duration_seconds_bucket[5m])) > 0.01 for: 5m labels: { severity: warning } - alert: HighGCCPU # GC 占用 30% 以上 CPU expr: rate(go_memstats_gc_cpu_fraction[5m]) > 0.3 for: 10m labels: { severity: warning } ``` ### 11.3 自动化 pprof 拉取 告警触发时人工登服务器太慢,写个小 daemon 在告警时自动拉 profile: ```go // prom-trigger 自动 dump 核心 func autoDumpOnAlert(w http.ResponseWriter, r *http.Request) { if r.URL.Query().Get("token") != os.Getenv("DUMP_TOKEN") { http.Error(w, "forbidden", http.StatusForbidden) return } go func() { // 拉 60s CPU profile f, _ := os.Create("/var/log/pprof/cpu_alert.pb.gz") defer f.Close() pprof.StartCPUProfile(f) time.Sleep(60 * time.Second) pprof.StopCPUProfile() // 同时拉 heap + goroutine for _, name := range []string{"heap", "goroutine"} { cmd := exec.Command("curl", "-s", "-o", fmt.Sprintf("/var/log/pprof/%s_alert.pb.gz", name), fmt.Sprintf("http://127.0.0.1:6060/debug/pprof/%s", name)) cmd.Run() } // 把文件 push 到 S3,归档 uploadToS3("/var/log/pprof/") }() w.Write([]byte("dump started")) } ``` 把这个 endpoint 接进 Alertmanager webhook,告警发生时自动留存"案发现场",后续人员即使是第二天上班都能拿到第一手 profile 数据。 ### 11.4 监控面板建议 Grafana 面板推荐布局: 1. **顶部**:Goroutine 数 + 堆分配 + 当前 RSS(一眼看出整体健康度) 2. **中段**:GC 停顿 P50/P99 + GC 频率 + GC 占用 CPU 比例 3. **下段**:QPS + P50/P99/P999 延迟 + 错误率 4. **底部**:fd 数 + goroutine 数 + runtime cpu 数(看是否打满) 任何一项指标如果突然"倾斜"(P99 从 100ms 涨到 1s),配合历史归档的 profile 可以 5 分钟内定位到代码行。 ## 十二、写在最后 Go 的 pprof 是 Go 生态里最被低估的工具之一。它不需要额外依赖、几乎零运行时开销、覆盖 CPU / 内存 / 调度 / 锁竞争 / 阻塞 / Goroutine 全维度数据,配合火焰图 + Pyroscope 连续 profiling 足够应对 99% 的性能问题。但工具只是工具,**真正决定定位速度的是你对"业务模型"的理解**——知道"订单服务的 Goroutine 大概应该有多少""库存服务每秒大概处理多少消息"这种经验值,比任何 profile 都先一步。 下次再遇到线上抖动,先别急着加机器或调 GOPROCS,按本文的顺序依次抓 profile,30 分钟内基本能定位到根因。